Sprawl is threatening to bankrupt us in more ways than we might realize. Let’s have a look at several basic costs of sprawl, with many more to come:

Until thirst for oil decreases, costs will continue to rise.
Direct Costs
The US imported over 4.3 billion barrels of oil in 2010, which at today’s price of $105/barrel is almost half a trillion dollars. A substantial percentage of imports comes from nations deemed dangerous or unstable. With each “uninstall” attempted on their dictators, the instability grows.
Much of that money goes to nations that don’t really like us all that well... and some downright hate us. So a portion of the half-trillion dollar annual impoverishment of the US gets into the hands of organizations bent on destroying us. How much harm would Osama bin Laden have been able to do without petroleum dollars? And what is the cost, in lives and dollars, of the wars waged as direct or indirect results of petro-dollars getting into the wrong hands?
Sprawl should shoulder much of the blame for this staggering expense. Study after study have shown that per-capita performance is substantially better in the city than in surrounding sprawl. This is no surprise, since sprawl requires us to drive everywhere.
The half-trillion hemorrhage, unfortunately, is only the beginning. Today, we’ll look at some of sprawl’s toll on city budgets. Later, we’ll continue that discussion and also look at its impact on neighborhoods and individuals.
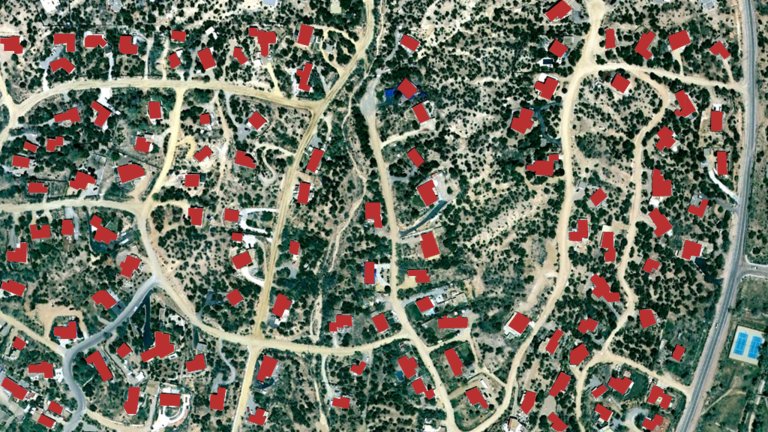
I lectured yesterday in Santa Fe on some of these issues, and illustrated them with a comparative study of two places. One was a sample of sprawl in the image at the top of this blog post. It was just north of downtown Santa Fe, but it could have been anywhere. It’s a 90 acre slice of sprawl exactly 1/2 mile wide. For comparison purposes, I took the exact same area and laid out a prototypical neighborhood based on New Urbanist principles. Note: This is not intended to be a specific neighborhood design. Rather, this is simply a diagram used to achieve metrics common within good New Urbanist design. Let’s look at the basic metrics of each example:

Sprawl
Housing Units: 114 (all single-family)
Shops & Offices: none
Civic Spaces: none
Civic Buildings: none
Arterial: 13.3 linear feet/unit
Main Street: none
Streets: 101.4 linear feet/unit
On-Street Parking: none
Service Thoroughfares: Driveways: 108 linear feet/unit

Neighborhood Metric
Housing Units: 814 (includes single-family units from cottages (throughout the plan) to mansions (on the right side of the plan,) townhouses, carriage houses, mews units, and live/work units over Main Street (on the left side of the plan)
Shops & Offices: 99.27 square feet/unit
Civic Spaces: 1 square & 4 playgrounds/pocket parks, total of 2.63 acres
Civic Buildings: 4, flanking the central square
Arterial: none
Main Street: 2.13 linear feet/unit
Streets: 28.03 linear feet/unit
On-Street Parking: 2.02 spaces/unit
Service Thoroughfares: Driveways: 9 linear feet/unit, Rear Lanes: 10.2 linear feet/unit, Alleys: 4.45 linear feet/unit
Note: if you’re wondering how the total linear footage of alleys and rear lanes can be so low, it’s because there are a significant number of mews units and carriage houses on the same alleys and rear lanes that serve housing units as well.
Since World War II, the US has chosen to build almost everything according to the sprawling pattern. Here are some of the consequences that choice has on city budgets:
Police
The sprawl above allows police to protect 46 housing units per mile of travel. The neighborhood allows police to protect 175 units in that same mile. This has a very real impact on police department budgets. While it might take the same length of time to apprehend a suspect in either setting, police don’t spend most of their time with guns drawn or handcuffs out. Rather, the lion’s share of their time in the field is spent on patrol in most places. Because each police team can protect only 1/4 as many homes per mile in sprawl, you need close to four times as many police in the field to afford the same degree of protection. The city also has to buy, fuel, and maintain four times as many patrol cars to get that same level of protection on patrol.

Fire
Fire protection has similar issues. Fire trucks don’t patrol the streets like police, of course, but the fire ratings that determine the cost of your homeowners’ insurance is based in no small part on a city’s average distance from fire stations to housing units. Larger numbers of units protected per mile of street allows the city to save its citizens many millions of dollars in insurance costs without having to build, staff, and equip nearly so many fire stations. And with some fire trucks topping a half-million dollars apiece, the total cost of a new fire station can be a major item in a city’s budget.
Dollars aren’t the whole story, however. For almost every house in sprawl, there’s only one way in: pull up to the front of the house and fight the fire (or the criminals) from there. Traditional neighborhoods, however, provide the additional benefit of alley or rear lane access, which just might be the difference in life and death in some emergencies.

